
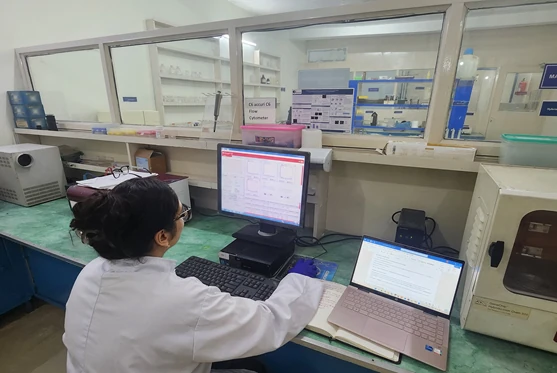
A flow cytometer measures single cells one at a time in suspension, at rates of hundreds to thousands of cells per second. What makes it distinctive is not sensitivity but distribution: instead of one averaged value for a well of cells, you get a value for every individual cell — so a mixed population resolves into its component parts rather than blending into a single mean.
Three Subsystems, Working Together
- Fluidics: sheath fluid surrounds the sample stream, and hydrodynamic focusing narrows it until cells file past the laser one by one. Everything downstream depends on this — two cells crossing together are recorded as a single event.
- Optics: lasers illuminate the interrogation point; dichroic mirrors and bandpass filters split the emitted light by wavelength so each detector sees one narrow band.
- Electronics: photodetectors convert photons into current, and each cell produces a pulse that is digitized as height, area, and width, then written as one row in the data file.
What Gets Measured per Cell in Flow Cytometry?
| Parameter | Physical Basis | Reports |
|---|---|---|
| FSC | Low-angle scatter | Relative size and refractive contrast |
| SSC | 90° scatter | Internal granularity and complexity |
| Fluorescence | Dye emission | Marker abundance, DNA content, dye uptake |
| Pulse width | Transit time | Doublets, aggregates, elongation |
Fluorescence, Spectra, and Spillover
A fluorophore absorbs at one wavelength and emits at a longer one, and emission spectra are broad — so a dye intended for one detector also deposits some signal in its neighbours. Compensation is the arithmetic step that subtracts this spillover using single-stained controls. Panel design is largely the art of choosing dyes whose overlaps the instrument can actually resolve; a useful rule of thumb is to put the brightest dye on the dimmest marker.
From Events to Populations
Plot Types
- Histogram: one parameter — best for a shift in a single marker or DNA-content peaks
- Dot / density plot: two parameters, the workhorse of everyday analysis
- Contour: population shape without dot saturation, good for publication figures
Gating Is the Analysis
Gates are applied hierarchically, each one narrowing the cells the next gate is drawn on. Because every statistic is expressed relative to its parent gate, a percentage means nothing without stating the hierarchy that produced it. Best practice is to draw gates on controls, freeze them as a template, and apply the same template to every sample in a series.
Three Kinds of Answer
- Frequency: percent of a parent gate — robust to cell loss during preparation
- Intensity: median fluorescence, never the mean, since fluorescence distributions are skewed
- Concentration: events per µL — direct on volumetric instruments, bead-referenced elsewhere
Strengths and Hard Limits
Flow cytometry delivers distributions rather than averages, many parameters on the same cell, and can find rare populations at 1 in 10⁴ or better — fast, quantitative, and statistically well-powered. Its limits are just as real: it works only on cells in suspension, so tissue architecture and spatial context are lost; there is no image, so subcellular localization is out of reach; and every number it produces inherits the gate that defined it.
Frequently Asked Questions
What is compensation and why is it necessary?
Compensation is the arithmetic correction for spectral overlap between fluorescent dyes. Because emission spectra are broad, a dye's signal spills into neighbouring detectors — compensation subtracts that spillover using single-stain controls so each channel reports only its intended dye.
What is an FMO control?
Fluorescence-minus-one — the full staining panel with exactly one dye removed. It is the most honest place to draw a positivity gate, since it accounts for spillover from every other dye in the panel.
Conclusion
Good flow cytometry data starts with understanding what the instrument physically measures and ends with disciplined gating and reporting. Our flow cytometry workshops and clinical FACS training walk through the full workflow hands-on.