
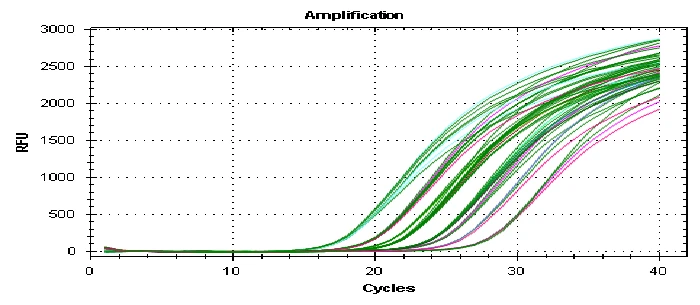
Real-time PCR (qPCR) measures amplification cycle-by-cycle rather than at a single endpoint. Fluorescence crosses a set threshold at a cycle number called Cq, which is log-linear with starting template amount — turning what used to be a gel-based, semi-quantitative reaction into a genuinely quantitative measurement.
Assay Design Basics
Short amplicons of 70–150 bp amplify most efficiently. Primers are checked in silico for specificity and secondary structure, then validated empirically — a dilution series is the only real proof that an assay behaves quantitatively. For expression work, primers spanning an exon–exon junction help avoid false signal from residual genomic DNA, which is otherwise the dominant source of error.
Detection Chemistry
A dsDNA-binding dye fluoresces on intercalation into any double-stranded product — cheap and flexible, but it reports primer-dimers and off-target product identically to the real amplicon, which is why a melt curve is mandatory with this chemistry. A hydrolysis probe, by contrast, is sequence-specific: a dual-labelled probe anneals inside the amplicon and is cleaved by the polymerase, separating reporter from quencher, which also allows several targets to be multiplexed by dye channel in one well.
What Are the Three Phases of a qPCR Amplification Curve?
| Phase | What's Happening |
|---|---|
| Baseline | Product is present but below detection; signal is instrument background (roughly cycles 3–15) |
| Exponential | Reagents are in excess and product doubles each cycle — the only region where quantification is valid |
| Plateau | Primers, dNTPs, and enzyme deplete; end-point fluorescence no longer tracks input |
Cq is where the amplification trace crosses a threshold set within the exponential phase — or, on modern software, the inflection point of a fitted curve. Under perfect doubling, one Cq unit equals a two-fold difference in starting template, and a 10-fold dilution shifts Cq by 3.32 cycles.
Standard Curve and Efficiency
A 5–6 point, 10-fold dilution series run in triplicate and plotted as Cq against log input gives the amplification efficiency from its slope. Anything outside the 90–110% efficiency range (ideal slope of −3.32, R² ≥ 0.99) invalidates the ΔΔCq method, which assumes matched efficiency between the target and reference gene.
Choosing a Quantification Model
- Absolute quantification: Cq is interpolated against a curve of known-concentration standards (plasmid, synthetic oligo, or quantified amplicon), reporting copies per reaction — required for viral load and GMO quantification.
- Relative quantification (ΔΔCq): the target is normalized to a reference gene, then to a control condition. Fold change = 2^(−ΔΔCq). No standards are needed, but it is only valid at matched efficiency between target and reference.
Frequently Asked Questions
Why did my no-template control (NTC) amplify?
This usually indicates reagent contamination or primer-dimer formation. Check the melt curve for a low-Tm peak distinct from the real product, and consider redesigning primers or lowering their concentration.
Can I trust a Cq value above 35?
Treat it as unreliable. At very low copy numbers, replicate Cq values scatter due to Poisson sampling statistics rather than any technical problem with the assay.
How many reference genes should I validate?
Validate 2–3 candidate reference genes per experimental system rather than relying on a single unvalidated housekeeping gene — this is the most common source of ΔΔCq errors.
Conclusion
Reliable qPCR data depends on a validated assay, an efficiency-checked standard curve, and consistent reporting of Cq values, efficiency, and replicate structure. Our Real-Time PCR services and hands-on workshops cover assay design through to full ΔΔCq analysis.